Key Concepts
Physics
Engineering
Earthquakes
Measurement
Introduction
Scientists study earthquakes so we can understand and predict them better. In this activity you will learn about one of the tools scientists use to measure the strength of an earthquake—and build your own machine using simple materials.
Background
Earthquakes happen all the time, but most of them are so small that we can't feel them, and they don't cause any damage. Large earthquakes, however, can be catastrophic—causing significant damage to property and loss of life. An earthquake's strength is measured on what is called the Richter scale. The Richter scale goes from 1 to 10. Each increase of 1 on the Richter scale means the earthquake is actually 10 times more powerful (for example a 2.0 earthquake is 10 times stronger than a 1.0 earthquake—not twice as strong). As of 2019 the strongest earthquake ever recorded measured 9.5 on the Richter scale.
On supporting science journalism
If you're enjoying this article, consider supporting our award-winning journalism by subscribing. By purchasing a subscription you are helping to ensure the future of impactful stories about the discoveries and ideas shaping our world today.
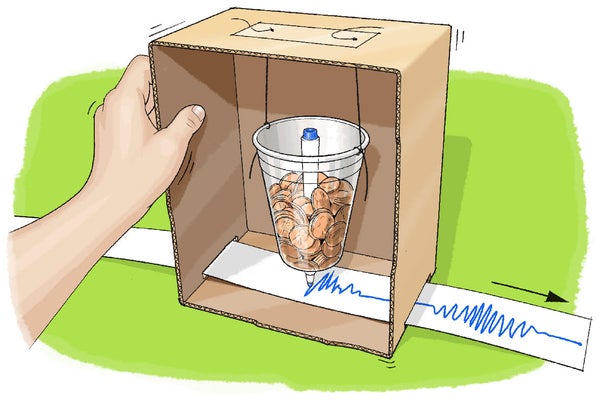
Scientists use a machine called a seismograph to measure the motion of the ground during an earthquake. Seismographs are very sensitive and can detect earthquakes that occur very far away (along with other things that make the ground shake, such as volcanic eruptions or large explosions) that might be too faint for humans to feel. Seismographs are made by hanging a heavy weight from a rigid frame connected to the ground. When the ground moves during an earthquake, the frame moves back and forth along with the ground. The heavy weight, however, is not connected directly to the ground, and it wants to stay in place. The result is that the weight holds still, while the frame moves back and forth around it. By placing a pen on the weight and paper on the frame scientists can see the relative motion of the weight and frame through the markings, which create a seismogram. The seismogram can be analyzed later to find out when an earthquake happened and how strong it was. Modern seismographs record this motion as an electrical signal, but in this activity you will build your own old-fashioned seismograph that uses a marker to record an "earthquake" on a paper strip.
Materials
Medium-sized cardboard box
Paper or plastic disposable cup
String
Marker
Scissors (have an adult help cut the cardboard and cup if needed)
Paper or a very long printed receipt from a store
Tape
Coins, marbles, small rocks or other small, heavy objects to use as weights
Another person to help
Graphing paper (optional)
Preparation
Carefully cut the lid or flaps off the cardboard box. Stand the box up on one of the smaller sides.
Carefully poke two holes opposite from each other near the rim of the cup.
Tie a piece of string (slightly longer than the length of the box) to each hole.
Carefully poke two holes in the top of the box (make them the same distance apart as the holes in the cup).
Push the two pieces of string through the box holes, and tie them together above the top of the box so the cup hangs down inside the box. The bottom of the cup should be about an inch above the bottom of the box.
Carefully poke a hole in the center of the bottom of the cup. Remove the cap from the marker, and push the marker through the hole so its tip just barely touches the bottom of the box.
Fill the cup with coins or other small weights. Why do you think the weights are important?
Fold a piece of paper in half lengthwise, then fold it in half again. Unfold the paper, and cut along the folds to form four equal-size strips. Tape the strips of paper together end to end, to form one long strip. (If you have a long printed receipt, you can skip this step)
Carefully cut two slits on opposite sides of the cardboard box—as close as possible to the bottom edge. The slits should be wide enough to pass the paper strip through one side, across the middle of the box, and out the other side.
Make sure the marker is centered on the paper strip. You might need to poke different holes in the top of the box and re-hang the cup if necessary.
Procedure
Now you are finally ready to use your seismograph! Stabilize the box with your hands as your helper slowly starts to slowly pull the paper strip through the box from side to side. What does the marker draw on the paper strip?
Now, shake the box back and forth as your helper continues to pull the paper strip through, doing their best to pull at a constant speed. How does the line on the paper strip change?
Pause your shaking for a few seconds, then try shaking the box harder.
Pause for a few more seconds, then shake the box very gently.
Pull the paper strip all the way out of the box, and look at the line. Can you tell how hard the box was shaking based on the line? Can you tell when the box was not shaking at all?
Repeat with additional strips of paper as you test out different shaking amounts.
Extra: Does your seismograph work if you shake the box side-to-side or up and down? Can you design a seismograph that can record motion in multiple directions?
Extra:Can you design your own scale for measuring the strength of your "earthquakes"? Try using graph paper, and see how different amounts of shaking measure up on your scale.
Observations and Results
When your helper pulls the paper through the box with no shaking the marker should just draw a straight line on the paper. When you shake the box, it moves back and forth, and the paper moves along with it. Because of the heavy mass of the cup and the way it is suspended by strings, the cup does not move as much. This means that the paper moves back and forth under the (mostly) stationary marker, resulting in a squiggly line. The size of these squiggles (called their amplitude) corresponds to how hard you shook the box—just like how the line drawn by a real seismograph corresponds to the strength of the earthquake.
More to Explore
Seismographs, from Incorporated Research Institutions for Seismology
Global Seismographic Network, from USGS
Earthquake-Proof Engineering for Skyscrapers, from Scientific American
Earthquake Rollers, from Scientific American
STEM Activities for Kids, from Science Buddies
This activity brought to you in partnership with Science Buddies
